
Portfolio
Welcome to my project portfolio — a curated collection of work where data meets purpose.
Each project below reflects a different facet of my skills in data analysis, machine learning, and storytelling through numbers. From predicting insurance costs to analyzing security incident patterns, these projects are more than technical exercises — they’re explorations of how data can drive clarity, insight, and better decisions.
Click through to explore the details, tools used, and real-world impact behind each one.
Incident Pattern Analyzer
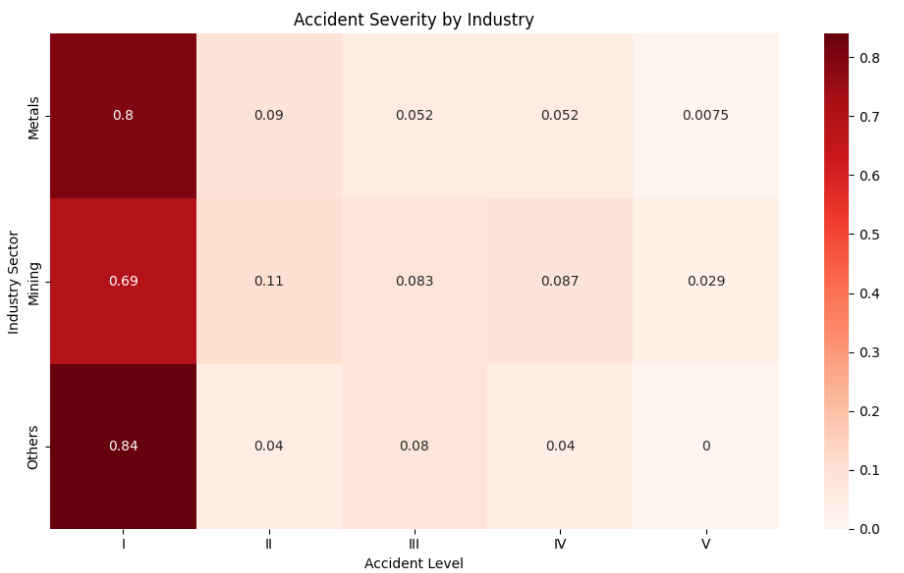
This project explores patterns in security incidents using publicly available data. I performed data cleaning, visualization, and temporal analysis to detect trends and anomalies. The goal was to support better crisis response planning through actionable insights and visual storytelling.
Tools: Python, Pandas, Matplotlib, Jupyter Notebook
Skills: Data wrangling, trend analysis, incident categorization
Insurance Cost Predictor – A Linear Regression Approach
This project applies linear regression to predict medical insurance charges based on demographic and lifestyle factors such as age, BMI, smoking status, and number of dependents. After cleaning and exploring the dataset, I trained a regression model to uncover patterns and quantify variable impact on healthcare costs.
The goal was to identify key predictors of insurance charges and demonstrate how regression can guide pricing strategies in the healthcare and insurance industries.
Tools & Skills:
Python, Pandas, Seaborn, Matplotlib, Scikit-learn, Google Colab
Linear Regression, Data Preprocessing, Feature Engineering, Model Evaluation

Iris Flower Classifier – Predicting Species with Random Forest
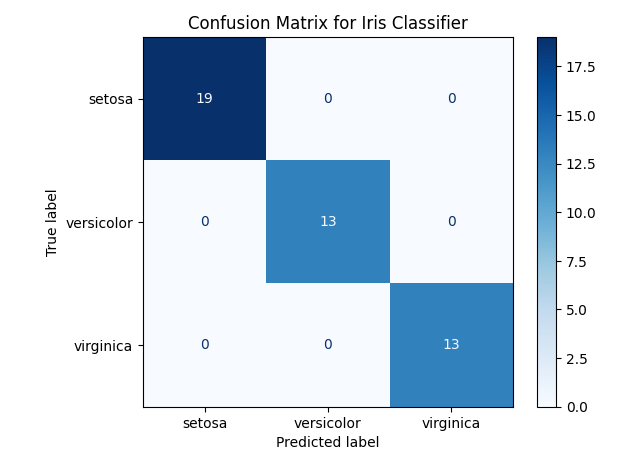
This machine learning project classifies iris flowers into three species — setosa, versicolor, and virginica — based on petal and sepal dimensions. I used a Random Forest Classifier for its accuracy and interpretability.
The project includes data exploration, feature visualization, model training, and performance evaluation using a confusion matrix and classification report. It's a great example of a supervised classification workflow using Scikit-learn.
🛠 Tools & Skills:
Python, Pandas, Matplotlib, Seaborn, Scikit-learn, Jupyter Notebook
Random Forest, Confusion Matrix, Data Visualization, Model Evaluation